Show the code
library("ggplot2")
library("pander")
In [1]:
library("ggplot2")
library("pander")In [2]:
ggAggHist <- getFromNamespace("ggAggHist", "dataMaid")
ggAggBarplot <- getFromNamespace("ggAggBarplot", "dataMaid")The dataset examined has the following dimensions:
| Feature | Result |
|---|---|
| Number of observations | 122 |
| Number of variables | 41 |
| Label | Variable | Class | # unique values | Missing | Description |
|---|---|---|---|---|---|
| [AGE] | integer | 43 | 0.82 % | ||
| [EDUCATION] | integer | 5 | 0.00 % | ||
| [SOCIALSTATUS] | integer | 9 | 0.00 % | ||
| [INCOME] | integer | 7 | 0.00 % | ||
| [RELIGIOUS_IDENTITY] | character | 9 | 0.00 % | ||
| [RACE] | character | 14 | 0.00 % | ||
| [STREETRACE] | integer | 8 | 1.64 % | ||
| [GENDER] | integer | 3 | 0.00 % | ||
| [SEXUAL_IDENTITY] | integer | 5 | 0.00 % | ||
| [POLITICALBELIEFS] | integer | 7 | 1.64 % | ||
| [POLITICALAFFIL] | integer | 6 | 15.57 % | ||
| [VOTE2024] | integer | 6 | 2.46 % | ||
| [SERIOUS] | integer | 2 | 0.82 % | ||
| [POLITICALPARTY] | character | 3 | 0.00 % | ||
| [SEX] | character | 2 | 0.00 % | ||
| [ETHNICITY] | character | 4 | 0.00 % | ||
| [Nationality] | character | 1 | 0.00 % | ||
| [Student.status] | character | 3 | 0.00 % | ||
| [Employment.status] | character | 7 | 0.00 % | ||
| [ZEROSUM_1] | integer | 7 | 0.00 % | ||
| [ZEROSUM_2] | integer | 8 | 0.82 % | ||
| [ZEROSUM_3] | integer | 8 | 0.82 % | ||
| [ZEROSUM_4] | integer | 8 | 0.82 % | ||
| [ZEROSUM_5] | integer | 7 | 0.00 % | ||
| [ZEROSUM_6] | integer | 8 | 0.82 % | ||
| [ZEROSUM_7] | integer | 8 | 1.64 % | ||
| [ZEROSUM_8] | integer | 8 | 0.82 % | ||
| [ZEROSUM_9] | integer | 8 | 0.82 % | ||
| [ZEROSUM_10] | integer | 7 | 0.00 % | ||
| [ZEROSUM_11] | integer | 8 | 0.82 % | ||
| [RACIALIDENTITY.6] | character | 6 | 0.00 % | ||
| [RACIALIDENTITY.4] | character | 4 | 0.00 % | ||
| [RACIALIDENTITY.2] | character | 2 | 0.00 % | ||
| [RI_White] | integer | 2 | 0.00 % | ||
| [RI_Else] | integer | 2 | 0.00 % | ||
| [GENDER_MALE] | integer | 2 | 0.00 % | ||
| [RACE_BLACK] | integer | 2 | 0.00 % | ||
| [RACE_ASIAN] | integer | 2 | 0.00 % | ||
| [RACE_OTHER] | integer | 2 | 0.00 % | ||
| [RELIGIOUS_YES] | integer | 2 | 0.00 % | ||
| [EDUCATION_HIGH] | integer | 2 | 0.00 % |
| Feature | Result |
|---|---|
| Variable type | integer |
| Number of missing obs. | 1 (0.82 %) |
| Number of unique values | 42 |
| Median | 33 |
| 1st and 3rd quartiles | 27; 43 |
| Min. and max. | 19; 73 |
In [3]:
ggAggHist(data = structure(list(xmin = c(15L, 20L, 25L, 30L,
35L, 40L, 45L, 50L, 55L, 60L, 65L, 70L), xmax = c(20L, 25L, 30L,
35L, 40L, 45L, 50L, 55L, 60L, 65L, 70L, 75L), ymin = c(0, 0,
0, 0, 0, 0, 0, 0, 0, 0, 0, 0), ymax = c(6L, 21L, 25L, 17L, 16L,
9L, 6L, 9L, 6L, 2L, 2L, 2L)), class = "data.frame", row.names = c(NA,
-12L)), vnam = "AGE")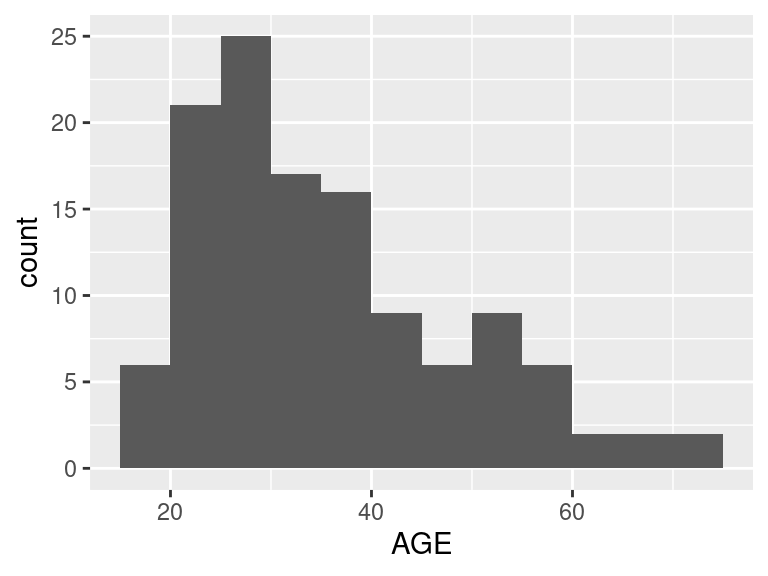
| Feature | Result |
|---|---|
| Variable type | integer |
| Number of missing obs. | 0 (0 %) |
| Number of unique values | 5 |
| Median | 5 |
| 1st and 3rd quartiles | 4; 6 |
| Min. and max. | 2; 6 |
In [4]:
ggAggHist(data = structure(list(xmin = c(2, 2.5, 3, 3.5, 4, 4.5,
5, 5.5), xmax = c(2.5, 3, 3.5, 4, 4.5, 5, 5.5, 6), ymin = c(0,
0, 0, 0, 0, 0, 0, 0), ymax = c(8L, 21L, 0L, 7L, 0L, 46L, 0L,
40L)), class = "data.frame", row.names = c(NA, -8L)), vnam = "EDUCATION")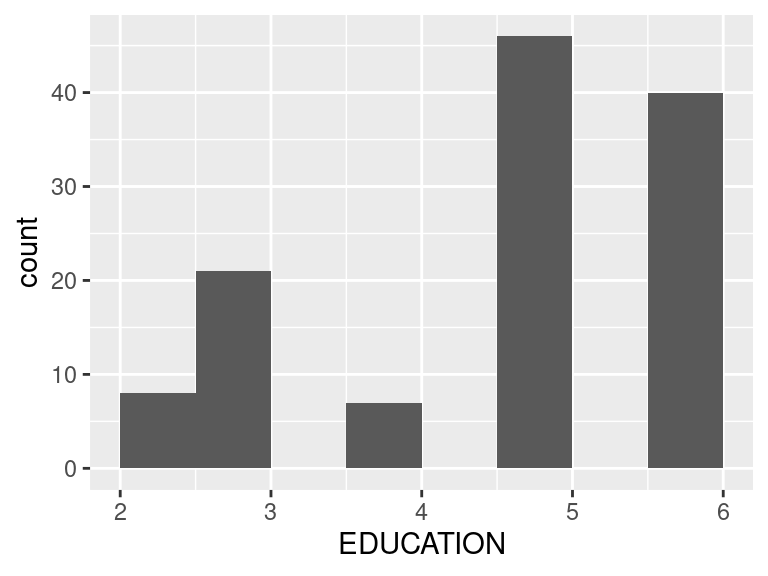
| Feature | Result |
|---|---|
| Variable type | integer |
| Number of missing obs. | 0 (0 %) |
| Number of unique values | 7 |
| Median | 4 |
| 1st and 3rd quartiles | 2; 5 |
| Min. and max. | 1; 7 |
In [6]:
ggAggHist(data = structure(list(xmin = 1:6, xmax = 2:7, ymin = c(0,
0, 0, 0, 0, 0), ymax = c(37L, 22L, 14L, 36L, 11L, 2L)), class = "data.frame", row.names = c(NA,
-6L)), vnam = "INCOME")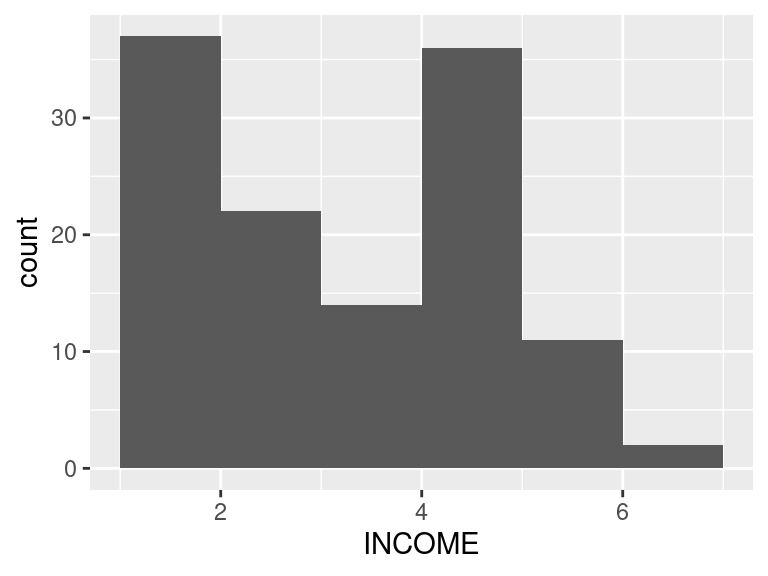
| Feature | Result |
|---|---|
| Variable type | character |
| Number of missing obs. | 0 (0 %) |
| Number of unique values | 9 |
| Mode | “1” |
In [7]:
ggAggBarplot(data = structure(list(x = structure(1:9, levels = c("-99",
"1", "2", "4", "5,9", "6", "7", "8", "9"), class = "factor"),
    y = c(3L, 65L, 2L, 2L, 1L, 1L, 1L, 4L, 43L)), class = "data.frame", row.names = c(NA,
-9L)), vnam = "RELIGIOUS_IDENTITY")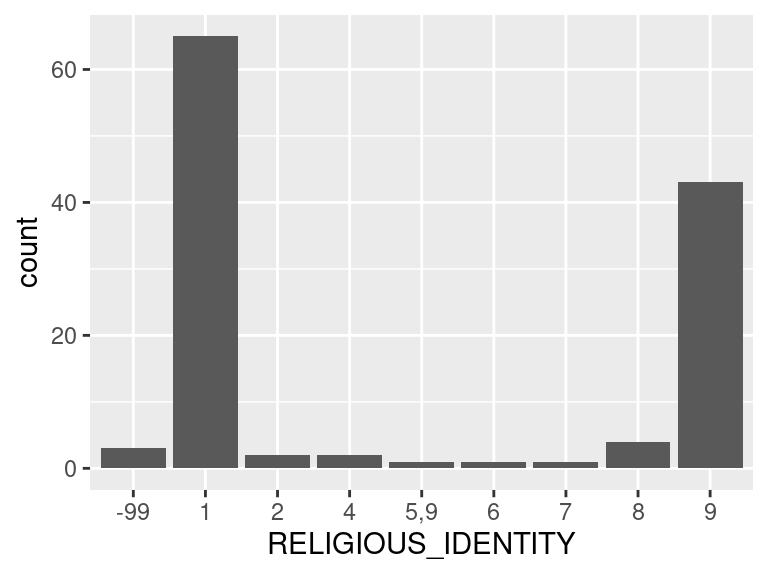
| Feature | Result |
|---|---|
| Variable type | character |
| Number of missing obs. | 0 (0 %) |
| Number of unique values | 14 |
| Mode | “7” |
In [8]:
ggAggBarplot(data = structure(list(x = structure(1:14, levels = c("1,7",
"2", "2,3", "2,7", "3", "3,4,7", "3,6", "3,7", "4", "4,7", "5",
"6", "7", "8"), class = "factor"), y = c(2L, 23L, 1L, 2L, 28L,
1L, 1L, 2L, 9L, 1L, 1L, 1L, 49L, 1L)), class = "data.frame", row.names = c(NA,
-14L)), vnam = "RACE")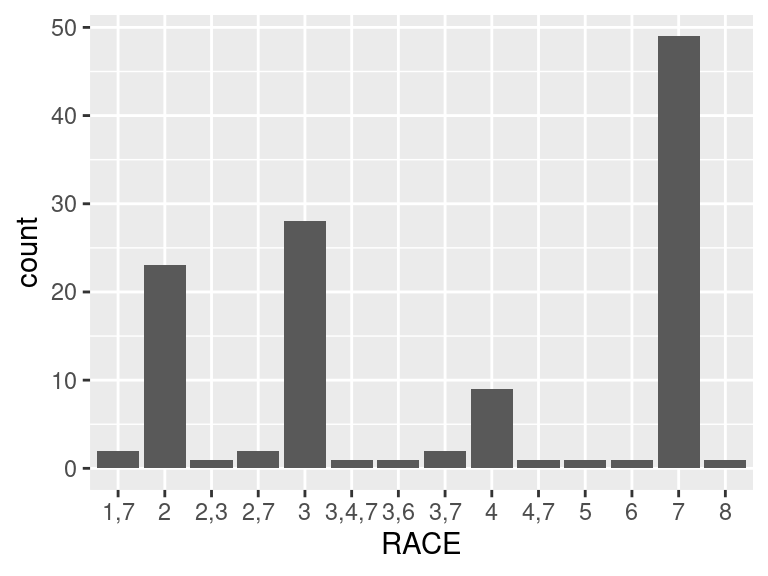
| Feature | Result |
|---|---|
| Variable type | integer |
| Number of missing obs. | 2 (1.64 %) |
| Number of unique values | 7 |
| Median | 3 |
| 1st and 3rd quartiles | 3; 5 |
| Min. and max. | 1; 8 |
In [9]:
ggAggHist(data = structure(list(xmin = 1:7, xmax = 2:8, ymin = c(0,
0, 0, 0, 0, 0, 0), ymax = c(24L, 54L, 7L, 30L, 0L, 4L, 1L)), class = "data.frame", row.names = c(NA,
-7L)), vnam = "STREETRACE")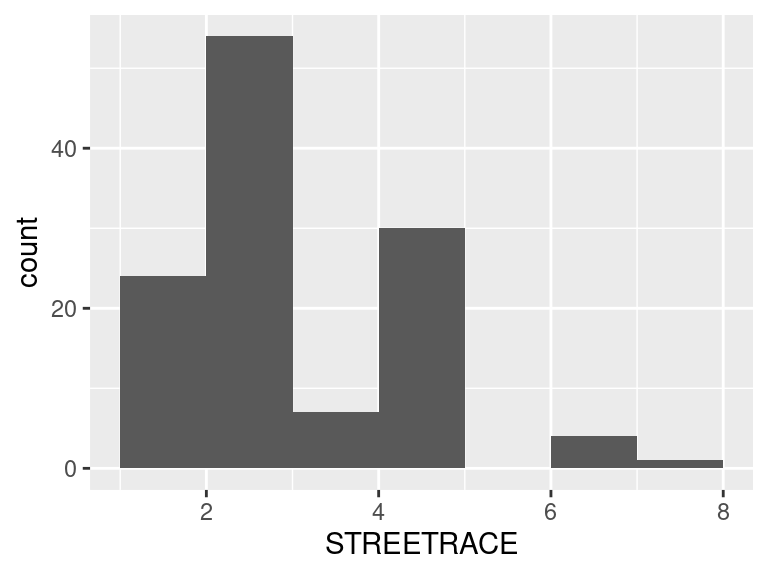
| Feature | Result |
|---|---|
| Variable type | integer |
| Number of missing obs. | 0 (0 %) |
| Number of unique values | 3 |
| Median | 2 |
| 1st and 3rd quartiles | 1; 2 |
| Min. and max. | 1; 3 |
In [10]:
ggAggHist(data = structure(list(xmin = c(1, 1.2, 1.4, 1.6, 1.8,
2, 2.2, 2.4, 2.6, 2.8), xmax = c(1.2, 1.4, 1.6, 1.8, 2, 2.2,
2.4, 2.6, 2.8, 3), ymin = c(0, 0, 0, 0, 0, 0, 0, 0, 0, 0), ymax = c(58L,
0L, 0L, 0L, 60L, 0L, 0L, 0L, 0L, 4L)), class = "data.frame", row.names = c(NA,
-10L)), vnam = "GENDER")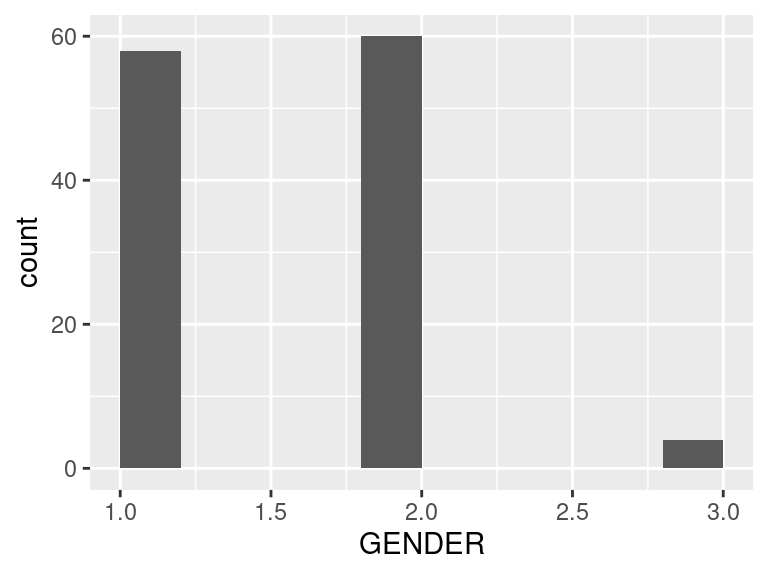
| Feature | Result |
|---|---|
| Variable type | integer |
| Number of missing obs. | 0 (0 %) |
| Number of unique values | 5 |
| Median | 1 |
| 1st and 3rd quartiles | 1; 2 |
| Min. and max. | 1; 5 |
In [11]:
ggAggHist(data = structure(list(xmin = c(1, 1.5, 2, 2.5, 3, 3.5,
4, 4.5), xmax = c(1.5, 2, 2.5, 3, 3.5, 4, 4.5, 5), ymin = c(0,
0, 0, 0, 0, 0, 0, 0), ymax = c(85L, 10L, 0L, 22L, 0L, 4L, 0L,
1L)), class = "data.frame", row.names = c(NA, -8L)), vnam = "SEXUAL_IDENTITY")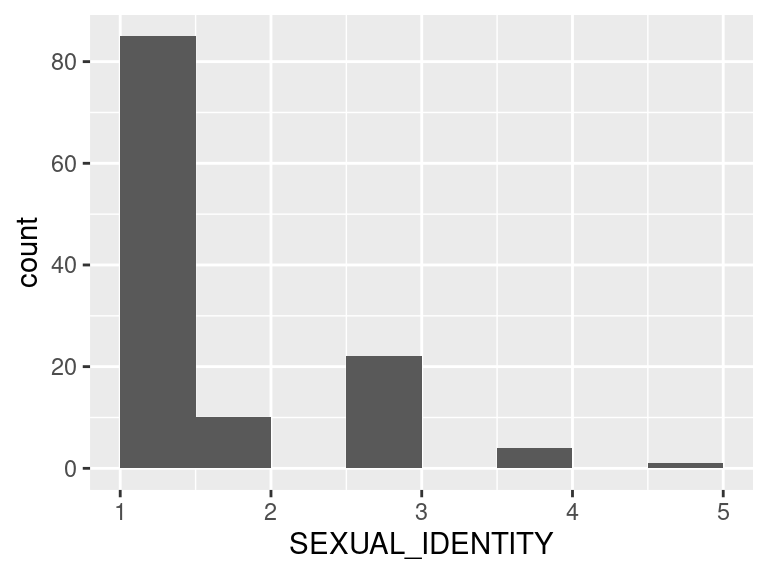
| Feature | Result |
|---|---|
| Variable type | integer |
| Number of missing obs. | 2 (1.64 %) |
| Number of unique values | 6 |
| Median | 4 |
| 1st and 3rd quartiles | 3; 5 |
| Min. and max. | 1; 6 |
In [12]:
ggAggHist(data = structure(list(xmin = c(1, 1.5, 2, 2.5, 3, 3.5,
4, 4.5, 5, 5.5), xmax = c(1.5, 2, 2.5, 3, 3.5, 4, 4.5, 5, 5.5,
6), ymin = c(0, 0, 0, 0, 0, 0, 0, 0, 0, 0), ymax = c(7L, 17L,
0L, 32L, 0L, 27L, 0L, 27L, 0L, 10L)), class = "data.frame", row.names = c(NA,
-10L)), vnam = "POLITICALBELIEFS")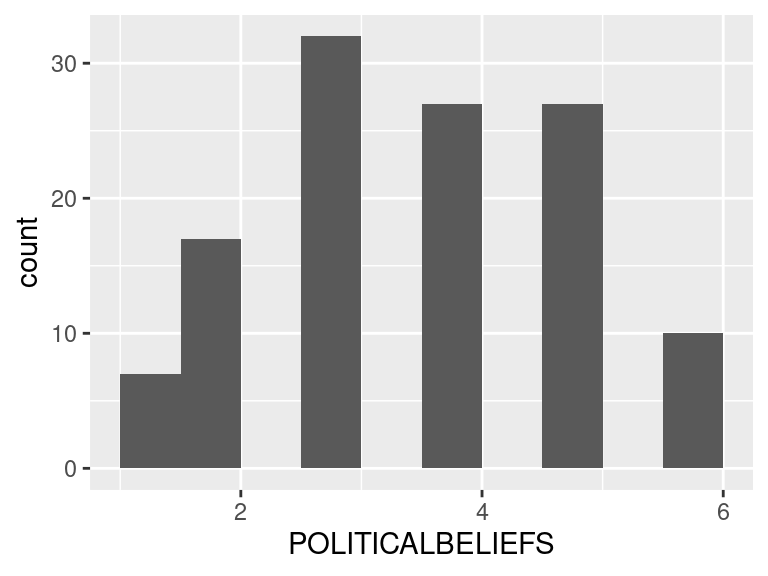
| Feature | Result |
|---|---|
| Variable type | integer |
| Number of missing obs. | 19 (15.57 %) |
| Number of unique values | 5 |
| Median | 2 |
| 1st and 3rd quartiles | 2; 4 |
| Min. and max. | 1; 5 |
In [13]:
ggAggHist(data = structure(list(xmin = c(1, 1.5, 2, 2.5, 3, 3.5,
4, 4.5), xmax = c(1.5, 2, 2.5, 3, 3.5, 4, 4.5, 5), ymin = c(0,
0, 0, 0, 0, 0, 0, 0), ymax = c(9L, 52L, 0L, 8L, 0L, 33L, 0L,
1L)), class = "data.frame", row.names = c(NA, -8L)), vnam = "POLITICALAFFIL")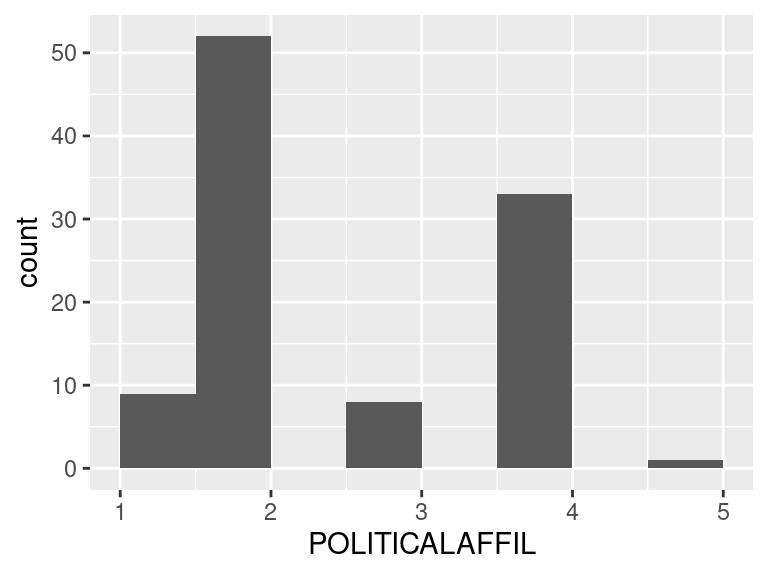
| Feature | Result |
|---|---|
| Variable type | integer |
| Number of missing obs. | 3 (2.46 %) |
| Number of unique values | 5 |
| Median | 2 |
| 1st and 3rd quartiles | 1; 2 |
| Min. and max. | 1; 8 |
In [14]:
ggAggHist(data = structure(list(xmin = 1:7, xmax = 2:8, ymin = c(0,
0, 0, 0, 0, 0, 0), ymax = c(101L, 0L, 0L, 1L, 0L, 1L, 16L)), class = "data.frame", row.names = c(NA,
-7L)), vnam = "VOTE2024")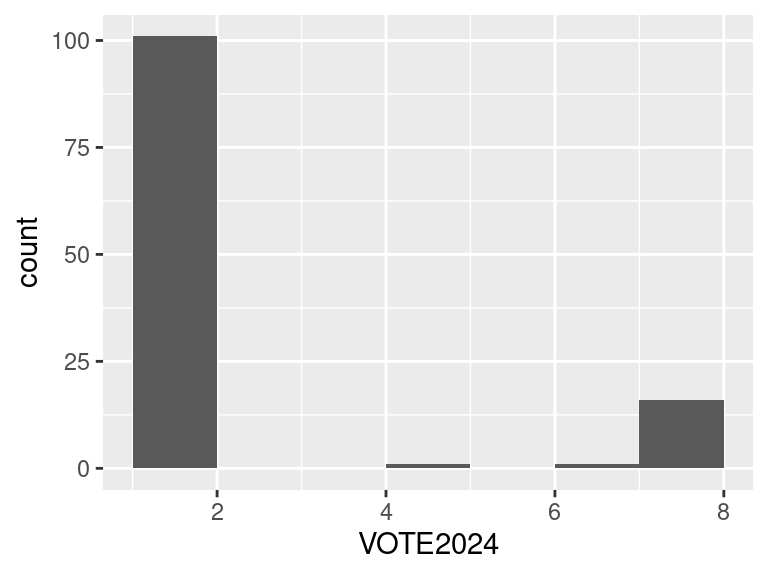
| Feature | Result |
|---|---|
| Variable type | character |
| Number of missing obs. | 0 (0 %) |
| Number of unique values | 3 |
| Mode | “Democrat” |
In [15]:
ggAggBarplot(data = structure(list(x = structure(1:3, levels = c("Democrat",
"Independent", "Republican"), class = "factor"), y = c(43L, 40L,
39L)), class = "data.frame", row.names = c(NA, -3L)), vnam = "POLITICALPARTY")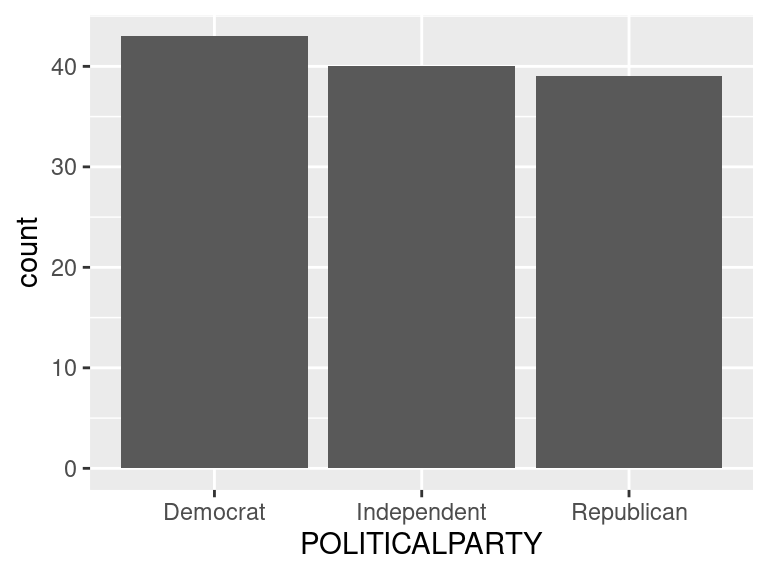
| Feature | Result |
|---|---|
| Variable type | character |
| Number of missing obs. | 0 (0 %) |
| Number of unique values | 2 |
| Mode | “Male” |
In [16]:
ggAggBarplot(data = structure(list(x = structure(1:2, levels = c("Female",
"Male"), class = "factor"), y = c(59L, 63L)), class = "data.frame", row.names = c(NA,
-2L)), vnam = "SEX")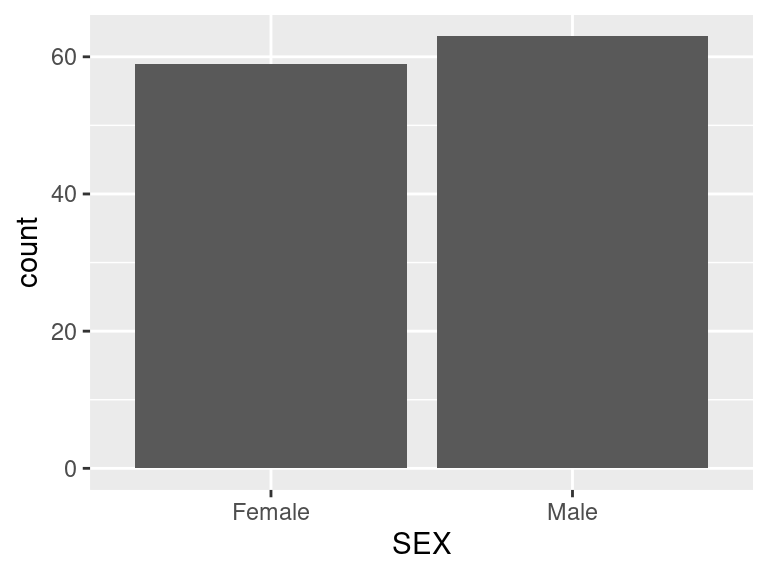
| Feature | Result |
|---|---|
| Variable type | character |
| Number of missing obs. | 0 (0 %) |
| Number of unique values | 4 |
| Mode | “White” |
In [17]:
ggAggBarplot(data = structure(list(x = structure(1:4, levels = c("Asian",
"Black", "Mixed/Other", "White"), class = "factor"), y = c(24L,
25L, 25L, 48L)), class = "data.frame", row.names = c(NA, -4L)),
    vnam = "ETHNICITY")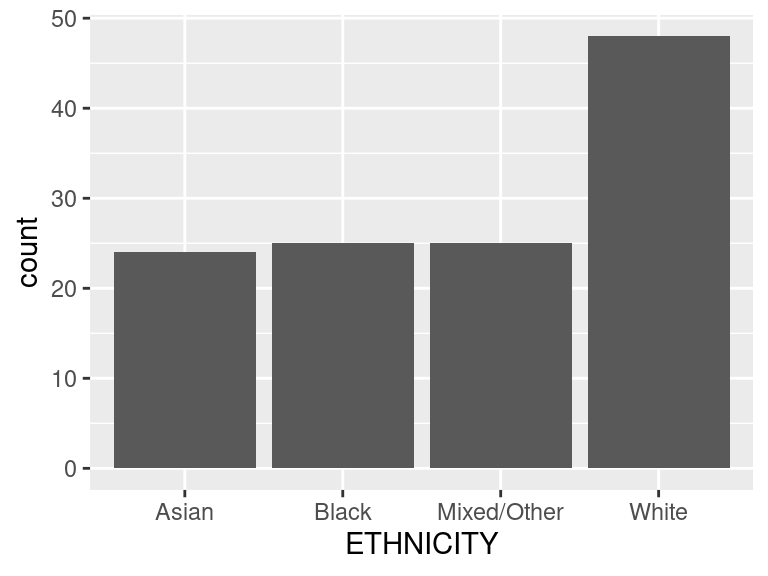
| Feature | Result |
|---|---|
| Variable type | character |
| Number of missing obs. | 0 (0 %) |
| Number of unique values | 3 |
| Mode | “No” |
In [18]:
ggAggBarplot(data = structure(list(x = structure(1:3, levels = c("DATA_EXPIRED",
"No", "Yes"), class = "factor"), y = c(18L, 74L, 30L)), class = "data.frame", row.names = c(NA,
-3L)), vnam = "Student.status")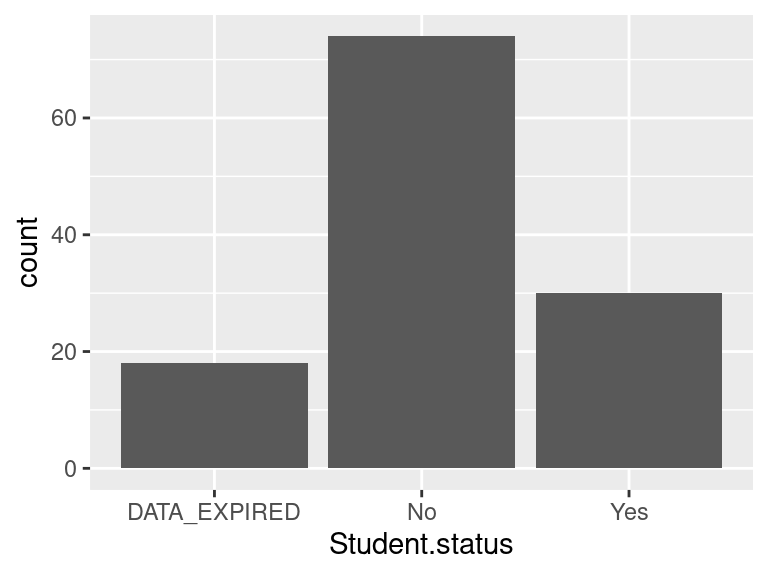
| Feature | Result |
|---|---|
| Variable type | character |
| Number of missing obs. | 0 (0 %) |
| Number of unique values | 7 |
| Mode | “Full-Time” |
In [19]:
ggAggBarplot(data = structure(list(x = structure(1:7, levels = c("DATA_EXPIRED",
"Due to start a new job within the next month", "Full-Time",
"Not in paid work (e.g. homemaker', 'retired or disabled)", "Other",
"Part-Time", "Unemployed (and job seeking)"), class = "factor"),
    y = c(17L, 1L, 50L, 10L, 3L, 29L, 12L)), class = "data.frame", row.names = c(NA,
-7L)), vnam = "Employment.status")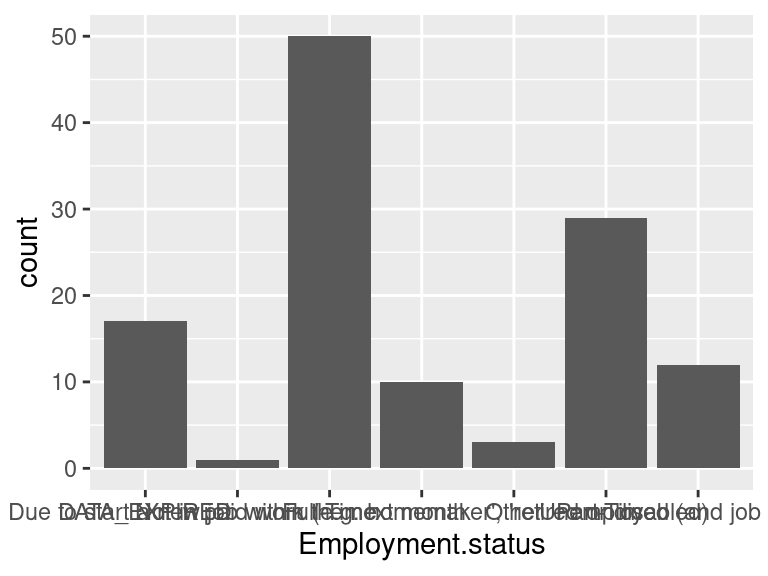
| Feature | Result |
|---|---|
| Variable type | integer |
| Number of missing obs. | 0 (0 %) |
| Number of unique values | 7 |
| Median | 4 |
| 1st and 3rd quartiles | 2.25; 5 |
| Min. and max. | 1; 7 |
In [20]:
ggAggHist(data = structure(list(xmin = 1:6, xmax = 2:7, ymin = c(0,
0, 0, 0, 0, 0), ymax = c(31L, 15L, 21L, 31L, 18L, 6L)), class = "data.frame", row.names = c(NA,
-6L)), vnam = "ZEROSUM_1")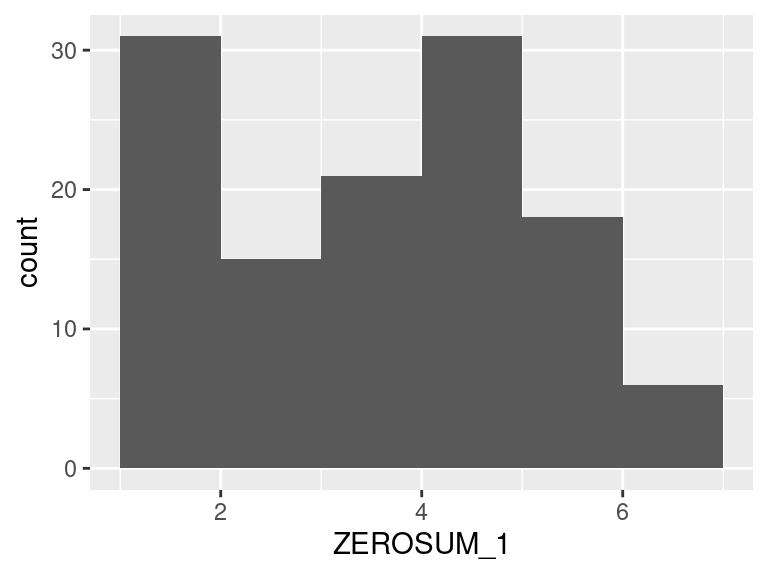
| Feature | Result |
|---|---|
| Variable type | integer |
| Number of missing obs. | 1 (0.82 %) |
| Number of unique values | 7 |
| Median | 5 |
| 1st and 3rd quartiles | 4; 6 |
| Min. and max. | 1; 7 |
In [21]:
ggAggHist(data = structure(list(xmin = 1:6, xmax = 2:7, ymin = c(0,
0, 0, 0, 0, 0), ymax = c(12L, 11L, 25L, 35L, 18L, 20L)), class = "data.frame", row.names = c(NA,
-6L)), vnam = "ZEROSUM_2")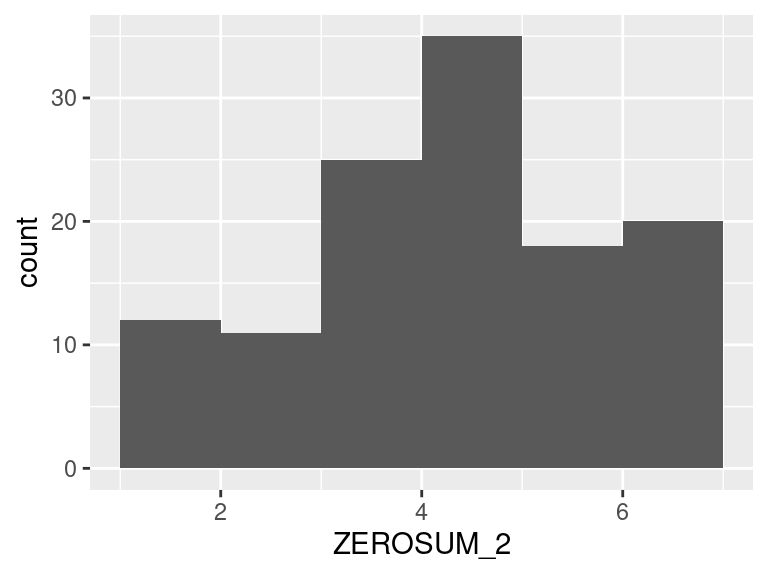
| Feature | Result |
|---|---|
| Variable type | integer |
| Number of missing obs. | 1 (0.82 %) |
| Number of unique values | 7 |
| Median | 5 |
| 1st and 3rd quartiles | 4; 6 |
| Min. and max. | 1; 7 |
In [22]:
ggAggHist(data = structure(list(xmin = 1:6, xmax = 2:7, ymin = c(0,
0, 0, 0, 0, 0), ymax = c(10L, 7L, 26L, 35L, 23L, 20L)), class = "data.frame", row.names = c(NA,
-6L)), vnam = "ZEROSUM_3")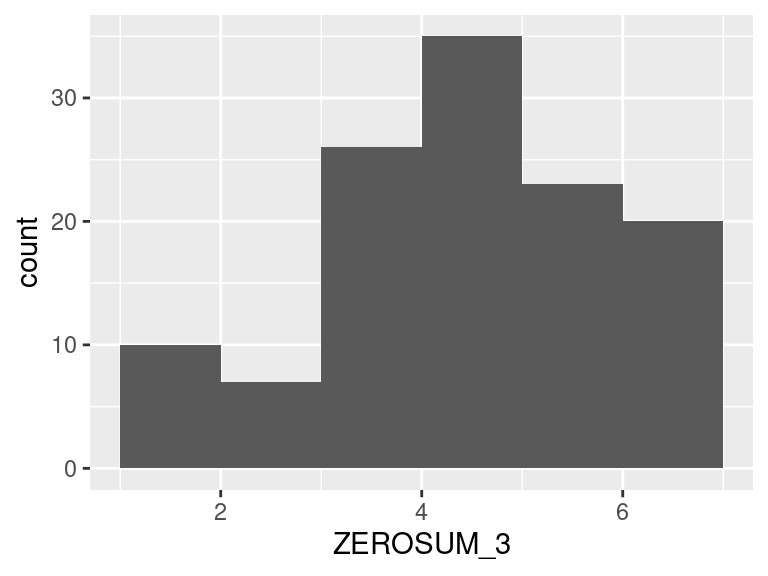
| Feature | Result |
|---|---|
| Variable type | integer |
| Number of missing obs. | 1 (0.82 %) |
| Number of unique values | 7 |
| Median | 3 |
| 1st and 3rd quartiles | 1; 4 |
| Min. and max. | 1; 7 |
In [23]:
ggAggHist(data = structure(list(xmin = 1:6, xmax = 2:7, ymin = c(0,
0, 0, 0, 0, 0), ymax = c(47L, 23L, 24L, 17L, 8L, 2L)), class = "data.frame", row.names = c(NA,
-6L)), vnam = "ZEROSUM_4")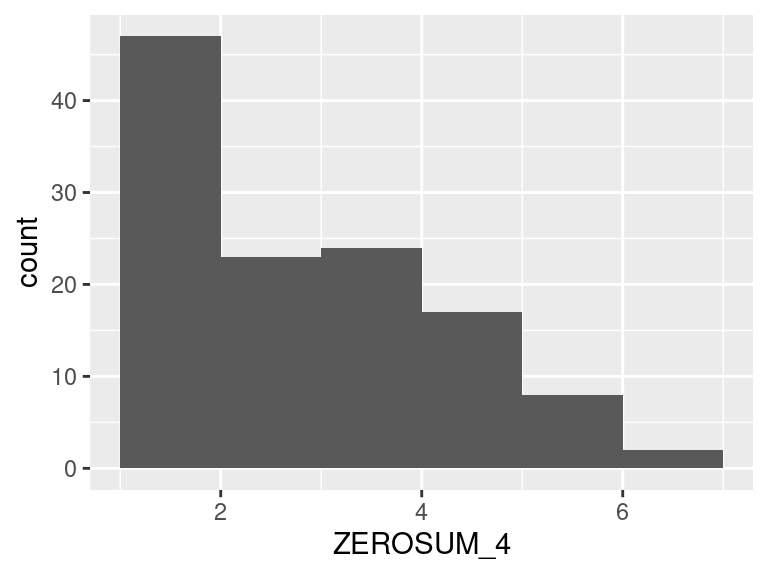
| Feature | Result |
|---|---|
| Variable type | integer |
| Number of missing obs. | 0 (0 %) |
| Number of unique values | 7 |
| Median | 3 |
| 1st and 3rd quartiles | 1; 4 |
| Min. and max. | 1; 7 |
In [24]:
ggAggHist(data = structure(list(xmin = 1:6, xmax = 2:7, ymin = c(0,
0, 0, 0, 0, 0), ymax = c(55L, 25L, 20L, 9L, 11L, 2L)), class = "data.frame", row.names = c(NA,
-6L)), vnam = "ZEROSUM_5")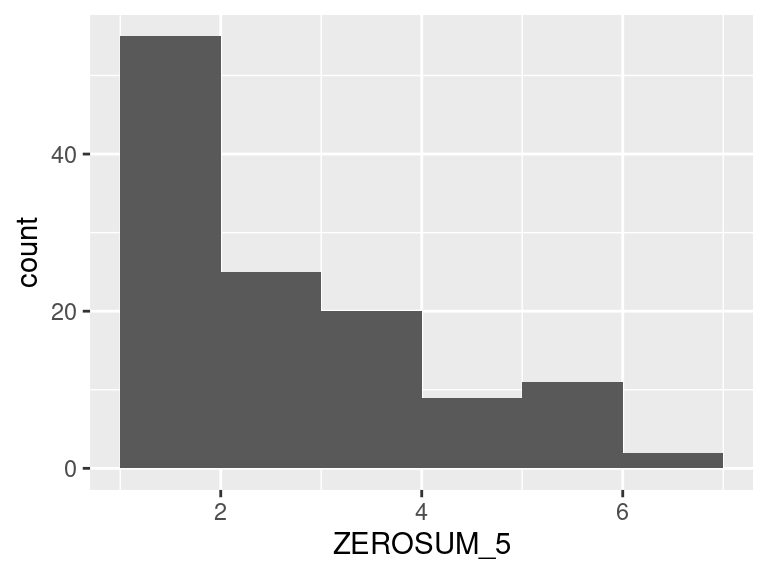
| Feature | Result |
|---|---|
| Variable type | integer |
| Number of missing obs. | 1 (0.82 %) |
| Number of unique values | 7 |
| Median | 3 |
| 1st and 3rd quartiles | 1; 5 |
| Min. and max. | 1; 7 |
In [25]:
ggAggHist(data = structure(list(xmin = 1:6, xmax = 2:7, ymin = c(0,
0, 0, 0, 0, 0), ymax = c(47L, 15L, 17L, 16L, 17L, 9L)), class = "data.frame", row.names = c(NA,
-6L)), vnam = "ZEROSUM_6")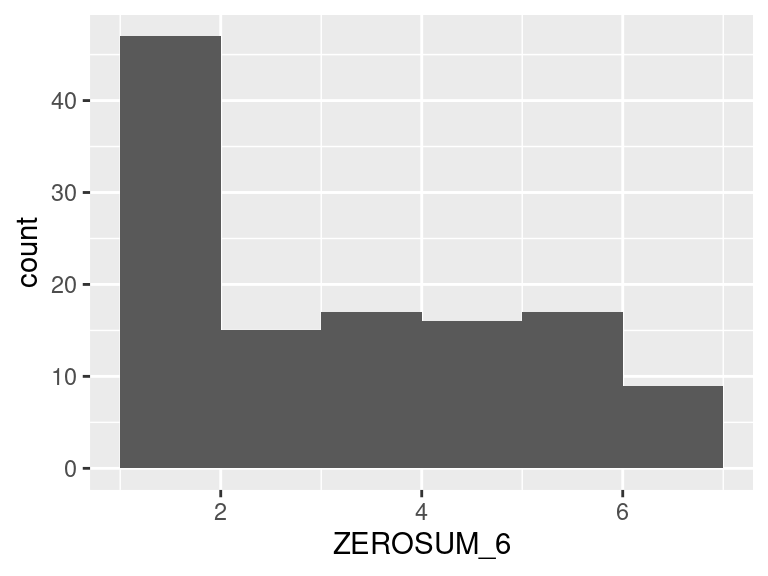
| Feature | Result |
|---|---|
| Variable type | integer |
| Number of missing obs. | 2 (1.64 %) |
| Number of unique values | 7 |
| Median | 4 |
| 1st and 3rd quartiles | 2; 5 |
| Min. and max. | 1; 7 |
In [26]:
ggAggHist(data = structure(list(xmin = 1:6, xmax = 2:7, ymin = c(0,
0, 0, 0, 0, 0), ymax = c(40L, 13L, 27L, 26L, 7L, 7L)), class = "data.frame", row.names = c(NA,
-6L)), vnam = "ZEROSUM_7")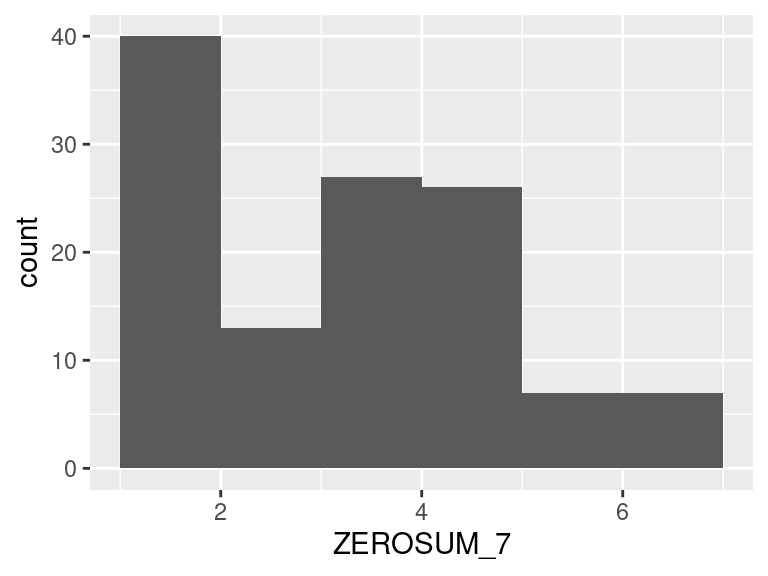
| Feature | Result |
|---|---|
| Variable type | integer |
| Number of missing obs. | 1 (0.82 %) |
| Number of unique values | 7 |
| Median | 3 |
| 1st and 3rd quartiles | 1; 4 |
| Min. and max. | 1; 7 |
In [27]:
ggAggHist(data = structure(list(xmin = 1:6, xmax = 2:7, ymin = c(0,
0, 0, 0, 0, 0), ymax = c(48L, 26L, 25L, 16L, 4L, 2L)), class = "data.frame", row.names = c(NA,
-6L)), vnam = "ZEROSUM_8")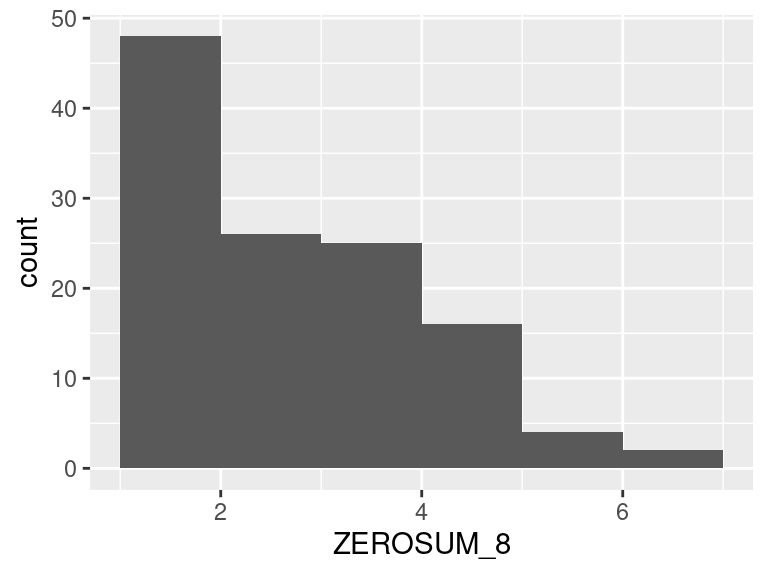
| Feature | Result |
|---|---|
| Variable type | integer |
| Number of missing obs. | 1 (0.82 %) |
| Number of unique values | 7 |
| Median | 2 |
| 1st and 3rd quartiles | 1; 4 |
| Min. and max. | 1; 7 |
In [28]:
ggAggHist(data = structure(list(xmin = 1:6, xmax = 2:7, ymin = c(0,
0, 0, 0, 0, 0), ymax = c(67L, 17L, 16L, 13L, 5L, 3L)), class = "data.frame", row.names = c(NA,
-6L)), vnam = "ZEROSUM_9")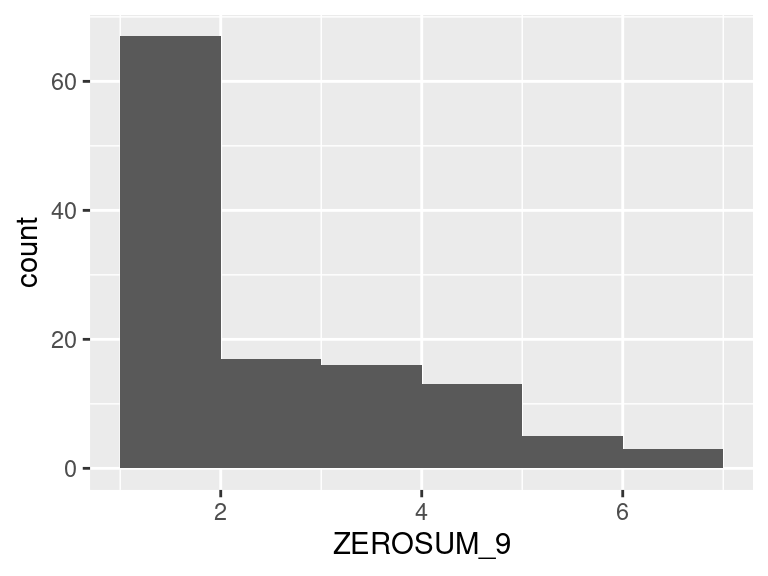
| Feature | Result |
|---|---|
| Variable type | integer |
| Number of missing obs. | 0 (0 %) |
| Number of unique values | 7 |
| Median | 3 |
| 1st and 3rd quartiles | 1; 5 |
| Min. and max. | 1; 7 |
In [29]:
ggAggHist(data = structure(list(xmin = 1:6, xmax = 2:7, ymin = c(0,
0, 0, 0, 0, 0), ymax = c(45L, 23L, 21L, 19L, 13L, 1L)), class = "data.frame", row.names = c(NA,
-6L)), vnam = "ZEROSUM_10")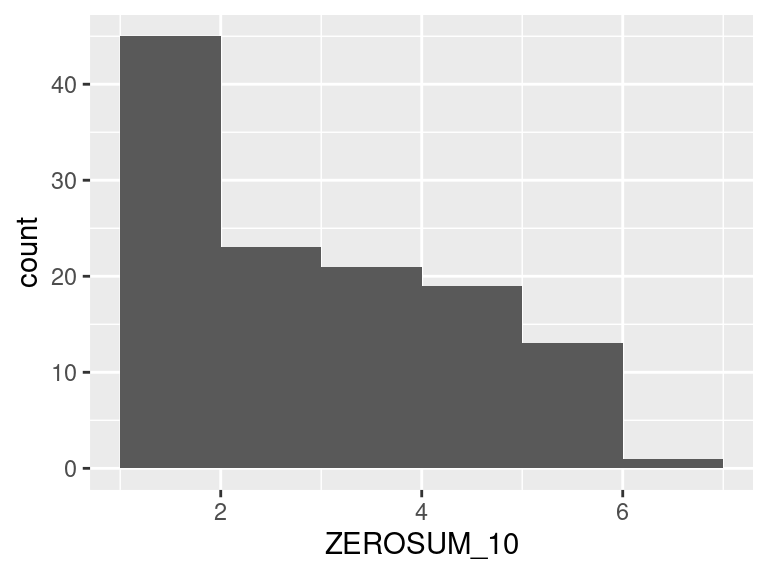
| Feature | Result |
|---|---|
| Variable type | integer |
| Number of missing obs. | 1 (0.82 %) |
| Number of unique values | 7 |
| Median | 3 |
| 1st and 3rd quartiles | 2; 4 |
| Min. and max. | 1; 7 |
In [30]:
ggAggHist(data = structure(list(xmin = 1:6, xmax = 2:7, ymin = c(0,
0, 0, 0, 0, 0), ymax = c(49L, 18L, 26L, 13L, 13L, 2L)), class = "data.frame", row.names = c(NA,
-6L)), vnam = "ZEROSUM_11")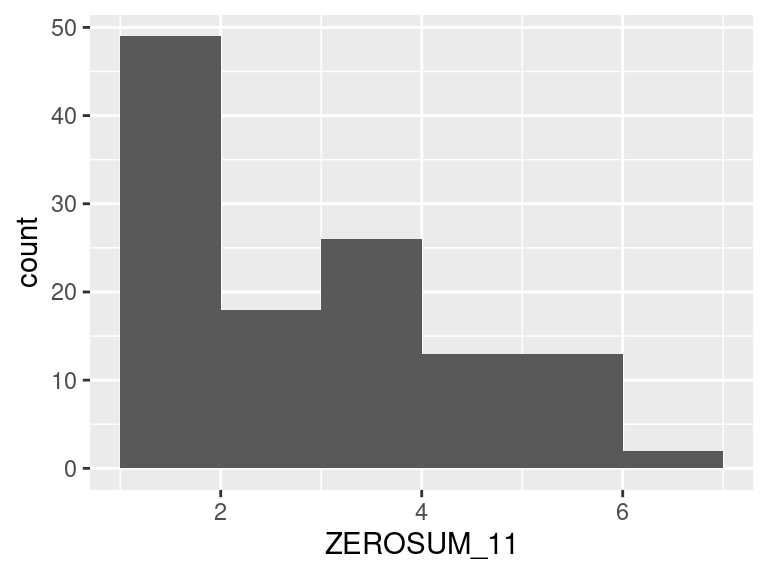
| Feature | Result |
|---|---|
| Variable type | character |
| Number of missing obs. | 0 (0 %) |
| Number of unique values | 6 |
| Mode | “White” |
In [31]:
ggAggBarplot(data = structure(list(x = structure(1:6, levels = c("Asian",
"Black", "Latine", "Mixed", "Other", "White"), class = "factor"),
    y = c(23L, 28L, 9L, 10L, 3L, 49L)), class = "data.frame", row.names = c(NA,
-6L)), vnam = "RACIALIDENTITY.6")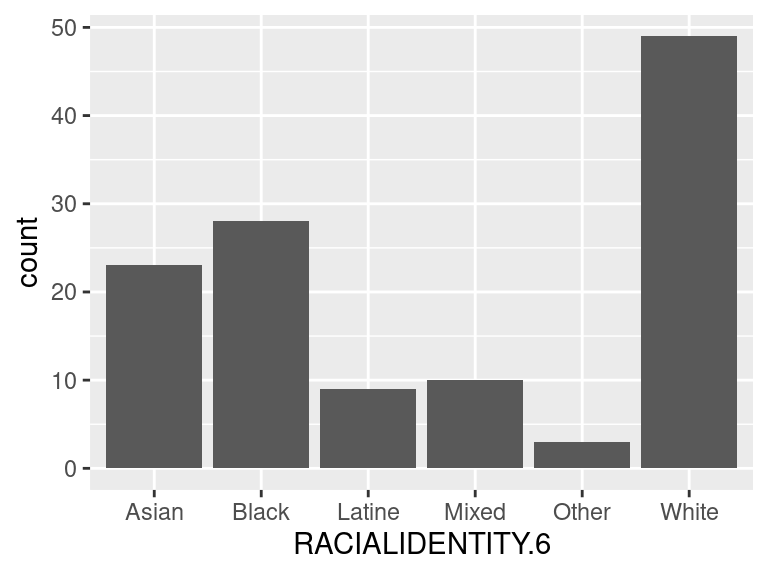
| Feature | Result |
|---|---|
| Variable type | character |
| Number of missing obs. | 0 (0 %) |
| Number of unique values | 4 |
| Mode | “White” |
In [32]:
ggAggBarplot(data = structure(list(x = structure(1:4, levels = c("Asian",
"Black", "Mixed/Other", "White"), class = "factor"), y = c(23L,
28L, 22L, 49L)), class = "data.frame", row.names = c(NA, -4L)),
    vnam = "RACIALIDENTITY.4")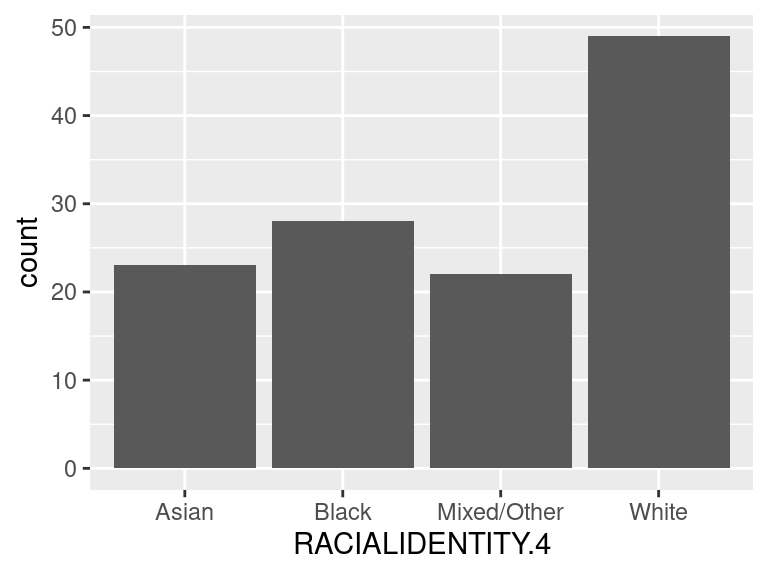
| Feature | Result |
|---|---|
| Variable type | character |
| Number of missing obs. | 0 (0 %) |
| Number of unique values | 2 |
| Mode | “Else” |
In [33]:
ggAggBarplot(data = structure(list(x = structure(1:2, levels = c("Else",
"White"), class = "factor"), y = c(73L, 49L)), class = "data.frame", row.names = c(NA,
-2L)), vnam = "RACIALIDENTITY.2")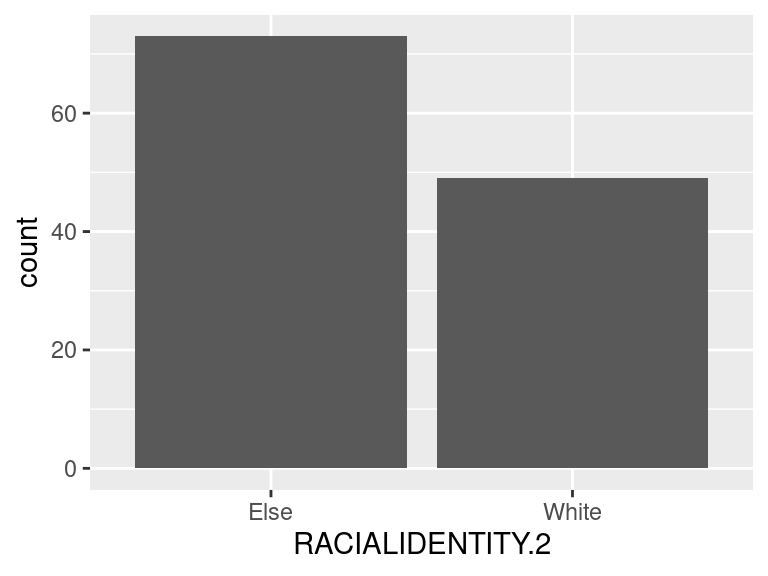
| Feature | Result |
|---|---|
| Variable type | integer |
| Number of missing obs. | 0 (0 %) |
| Number of unique values | 2 |
| Median | 0 |
| 1st and 3rd quartiles | 0; 1 |
| Min. and max. | 0; 1 |
In [34]:
ggAggHist(data = structure(list(xmin = c(0, 0.1, 0.2, 0.3, 0.4,
0.5, 0.6, 0.7, 0.8, 0.9), xmax = c(0.1, 0.2, 0.3, 0.4, 0.5, 0.6,
0.7, 0.8, 0.9, 1), ymin = c(0, 0, 0, 0, 0, 0, 0, 0, 0, 0), ymax = c(73L,
0L, 0L, 0L, 0L, 0L, 0L, 0L, 0L, 49L)), class = "data.frame", row.names = c(NA,
-10L)), vnam = "RI_White")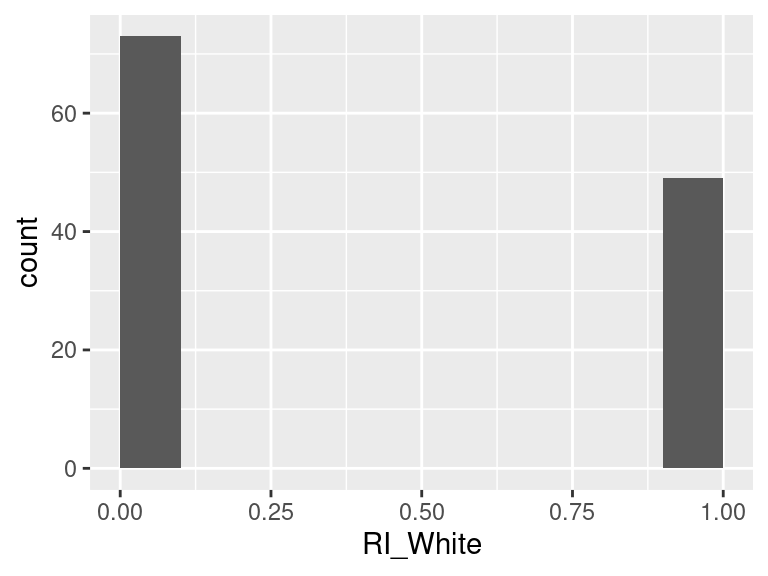
| Feature | Result |
|---|---|
| Variable type | integer |
| Number of missing obs. | 0 (0 %) |
| Number of unique values | 2 |
| Median | 1 |
| 1st and 3rd quartiles | 0; 1 |
| Min. and max. | 0; 1 |
In [35]:
ggAggHist(data = structure(list(xmin = c(0, 0.1, 0.2, 0.3, 0.4,
0.5, 0.6, 0.7, 0.8, 0.9), xmax = c(0.1, 0.2, 0.3, 0.4, 0.5, 0.6,
0.7, 0.8, 0.9, 1), ymin = c(0, 0, 0, 0, 0, 0, 0, 0, 0, 0), ymax = c(49L,
0L, 0L, 0L, 0L, 0L, 0L, 0L, 0L, 73L)), class = "data.frame", row.names = c(NA,
-10L)), vnam = "RI_Else")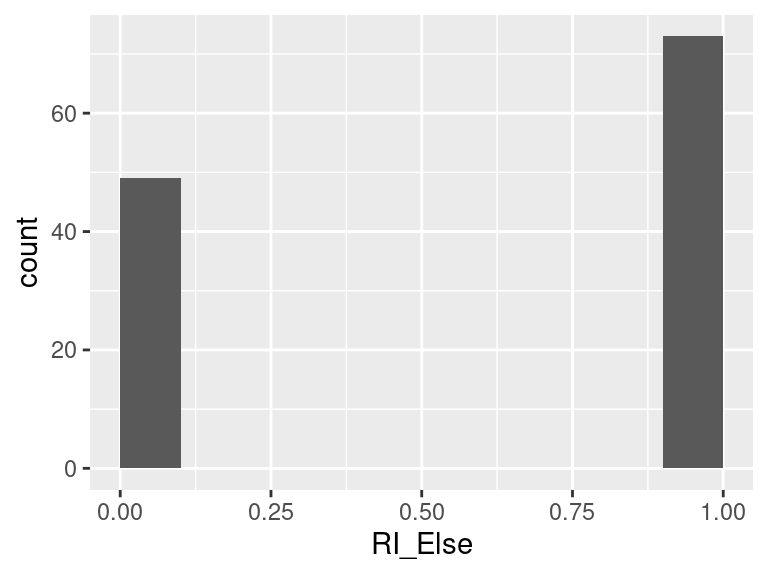
| Feature | Result |
|---|---|
| Variable type | integer |
| Number of missing obs. | 0 (0 %) |
| Number of unique values | 2 |
| Median | 1 |
| 1st and 3rd quartiles | 0; 1 |
| Min. and max. | 0; 1 |
In [36]:
ggAggHist(data = structure(list(xmin = c(0, 0.1, 0.2, 0.3, 0.4,
0.5, 0.6, 0.7, 0.8, 0.9), xmax = c(0.1, 0.2, 0.3, 0.4, 0.5, 0.6,
0.7, 0.8, 0.9, 1), ymin = c(0, 0, 0, 0, 0, 0, 0, 0, 0, 0), ymax = c(59L,
0L, 0L, 0L, 0L, 0L, 0L, 0L, 0L, 63L)), class = "data.frame", row.names = c(NA,
-10L)), vnam = "GENDER_MALE")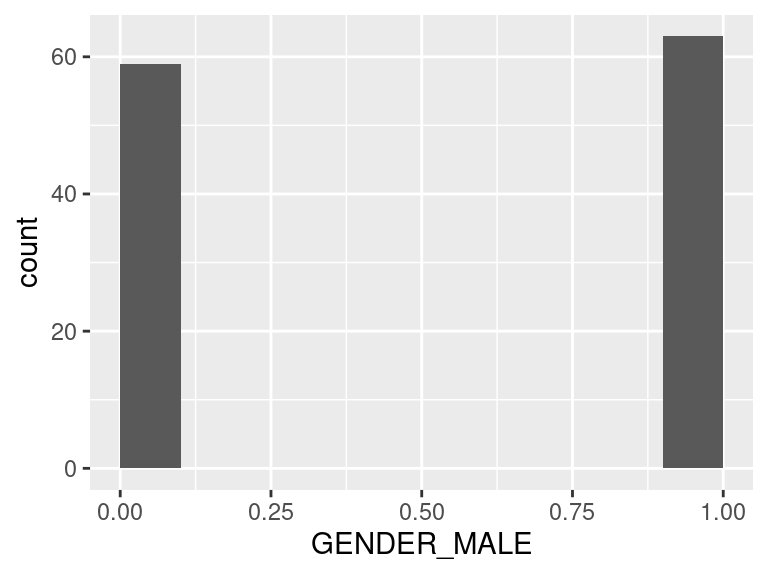
| Feature | Result |
|---|---|
| Variable type | integer |
| Number of missing obs. | 0 (0 %) |
| Number of unique values | 2 |
| Median | 0 |
| 1st and 3rd quartiles | 0; 0 |
| Min. and max. | 0; 1 |
In [37]:
ggAggHist(data = structure(list(xmin = c(0, 0.1, 0.2, 0.3, 0.4,
0.5, 0.6, 0.7, 0.8, 0.9), xmax = c(0.1, 0.2, 0.3, 0.4, 0.5, 0.6,
0.7, 0.8, 0.9, 1), ymin = c(0, 0, 0, 0, 0, 0, 0, 0, 0, 0), ymax = c(94L,
0L, 0L, 0L, 0L, 0L, 0L, 0L, 0L, 28L)), class = "data.frame", row.names = c(NA,
-10L)), vnam = "RACE_BLACK")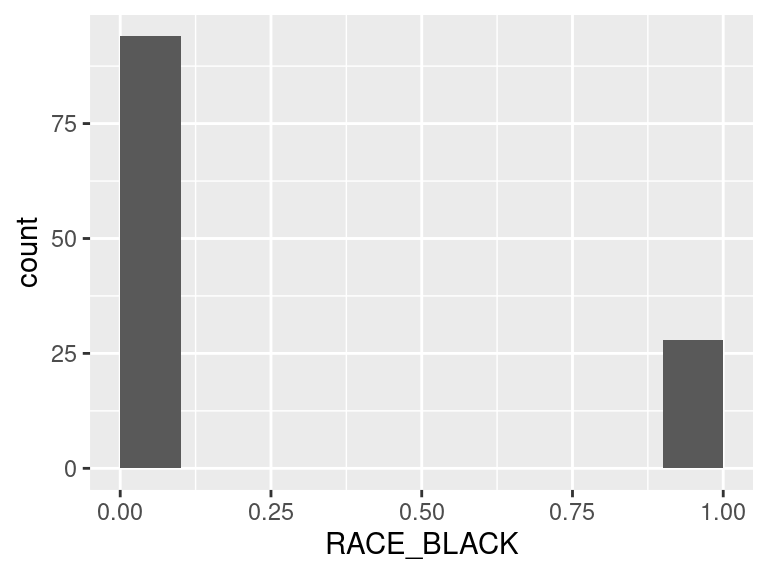
| Feature | Result |
|---|---|
| Variable type | integer |
| Number of missing obs. | 0 (0 %) |
| Number of unique values | 2 |
| Median | 0 |
| 1st and 3rd quartiles | 0; 0 |
| Min. and max. | 0; 1 |
In [38]:
ggAggHist(data = structure(list(xmin = c(0, 0.1, 0.2, 0.3, 0.4,
0.5, 0.6, 0.7, 0.8, 0.9), xmax = c(0.1, 0.2, 0.3, 0.4, 0.5, 0.6,
0.7, 0.8, 0.9, 1), ymin = c(0, 0, 0, 0, 0, 0, 0, 0, 0, 0), ymax = c(99L,
0L, 0L, 0L, 0L, 0L, 0L, 0L, 0L, 23L)), class = "data.frame", row.names = c(NA,
-10L)), vnam = "RACE_ASIAN")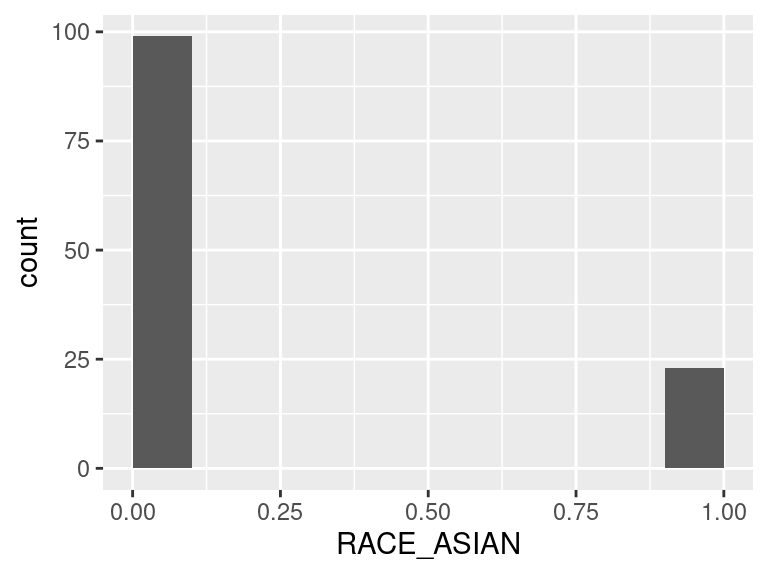
| Feature | Result |
|---|---|
| Variable type | integer |
| Number of missing obs. | 0 (0 %) |
| Number of unique values | 2 |
| Median | 0 |
| 1st and 3rd quartiles | 0; 0 |
| Min. and max. | 0; 1 |
In [39]:
ggAggHist(data = structure(list(xmin = c(0, 0.1, 0.2, 0.3, 0.4,
0.5, 0.6, 0.7, 0.8, 0.9), xmax = c(0.1, 0.2, 0.3, 0.4, 0.5, 0.6,
0.7, 0.8, 0.9, 1), ymin = c(0, 0, 0, 0, 0, 0, 0, 0, 0, 0), ymax = c(100L,
0L, 0L, 0L, 0L, 0L, 0L, 0L, 0L, 22L)), class = "data.frame", row.names = c(NA,
-10L)), vnam = "RACE_OTHER")
| Feature | Result |
|---|---|
| Variable type | integer |
| Number of missing obs. | 0 (0 %) |
| Number of unique values | 2 |
| Median | 1 |
| 1st and 3rd quartiles | 0; 1 |
| Min. and max. | 0; 1 |
In [40]:
ggAggHist(data = structure(list(xmin = c(0, 0.1, 0.2, 0.3, 0.4,
0.5, 0.6, 0.7, 0.8, 0.9), xmax = c(0.1, 0.2, 0.3, 0.4, 0.5, 0.6,
0.7, 0.8, 0.9, 1), ymin = c(0, 0, 0, 0, 0, 0, 0, 0, 0, 0), ymax = c(47L,
0L, 0L, 0L, 0L, 0L, 0L, 0L, 0L, 75L)), class = "data.frame", row.names = c(NA,
-10L)), vnam = "RELIGIOUS_YES")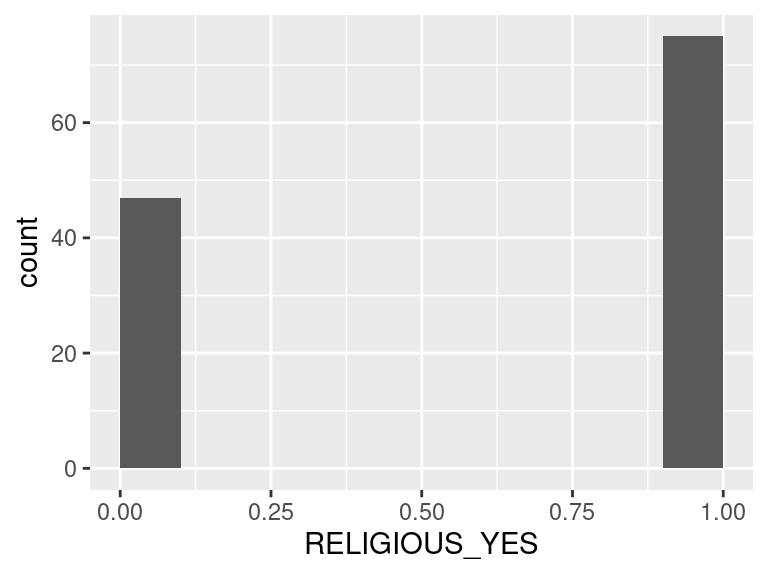
| Feature | Result |
|---|---|
| Variable type | integer |
| Number of missing obs. | 0 (0 %) |
| Number of unique values | 2 |
| Median | 1 |
| 1st and 3rd quartiles | 0; 1 |
| Min. and max. | 0; 1 |
In [41]:
ggAggHist(data = structure(list(xmin = c(0, 0.1, 0.2, 0.3, 0.4,
0.5, 0.6, 0.7, 0.8, 0.9), xmax = c(0.1, 0.2, 0.3, 0.4, 0.5, 0.6,
0.7, 0.8, 0.9, 1), ymin = c(0, 0, 0, 0, 0, 0, 0, 0, 0, 0), ymax = c(36L,
0L, 0L, 0L, 0L, 0L, 0L, 0L, 0L, 86L)), class = "data.frame", row.names = c(NA,
-10L)), vnam = "EDUCATION_HIGH")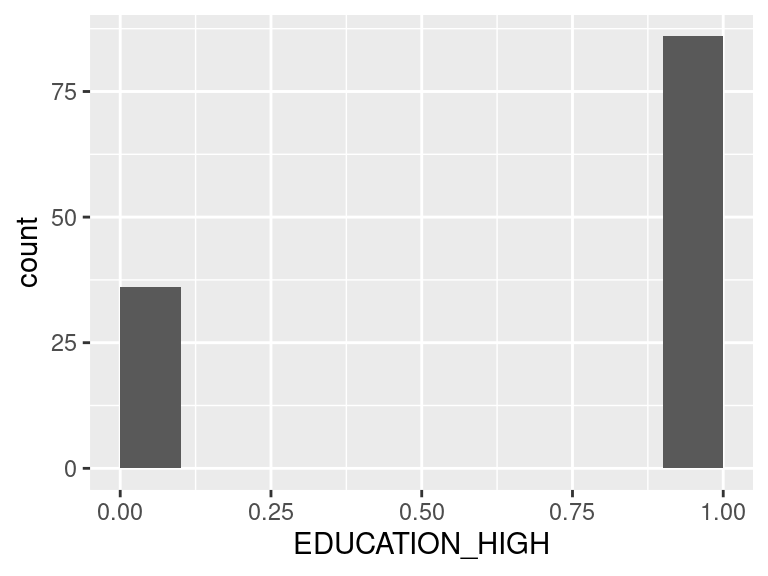
Report generation information:
Created by: Could not determine from system (username: r2672606).
Report creation time: Sat Jul 05 2025 20:23:53
Report was run from directory: /cloud/project
dataMaid v1.4.2 [Pkg: 2025-04-13 from RSPM (R 4.3.0)]
R version 4.3.3 (2024-02-29).
Platform: x86_64-pc-linux-gnu (64-bit)(UTC).
Function call: dataMaid::makeDataReport(data = select_data, render = TRUE, mode = c("summarize", "visualize", "check"), smartNum = FALSE, file = "select_data_codebook", replace = TRUE, checks = list(character = "showAllFactorLevels", factor = "showAllFactorLevels", labelled = "showAllFactorLevels", haven_labelled = "showAllFactorLevels", numeric = NULL, integer = NULL, logical = NULL, Date = NULL), listChecks = FALSE, maxProbVals = Inf, codebook = TRUE, reportTitle = "Codebook for select_data")
SOCIALSTATUS
Show the code